Current values, threshold state, last update, and device health stay visible across sites.
Product feature
Temperature monitoring dashboard for sites, assets, and history.
KRYOS gives teams one cloud temperature monitoring view for live readings, device state, alerts, and historical data across the locations they manage.
- Teams scan current values, threshold state, device status, and alerts before opening a specific asset.
- Multi-site temperature monitoring stays readable from one remote temperature dashboard instead of local checks.
- Historical readings, incidents, reports, and audit-ready records stay connected to the same monitored assets.
Cloud monitoring workspace
Rooms, fridges, freezers, and transport assets stay grouped by the places teams manage.
Earlier readings, alerts, notes, reports, and exports remain tied to the asset they describe.
KRYOS cloud temperature monitoring
Connected layers
Live device state
Multi-site visibility
Alert and report continuity
What a temperature monitoring dashboard should make visible
A useful temperature monitoring dashboard brings live values, threshold context, device health, alerts, analytics, and records into one operational view.
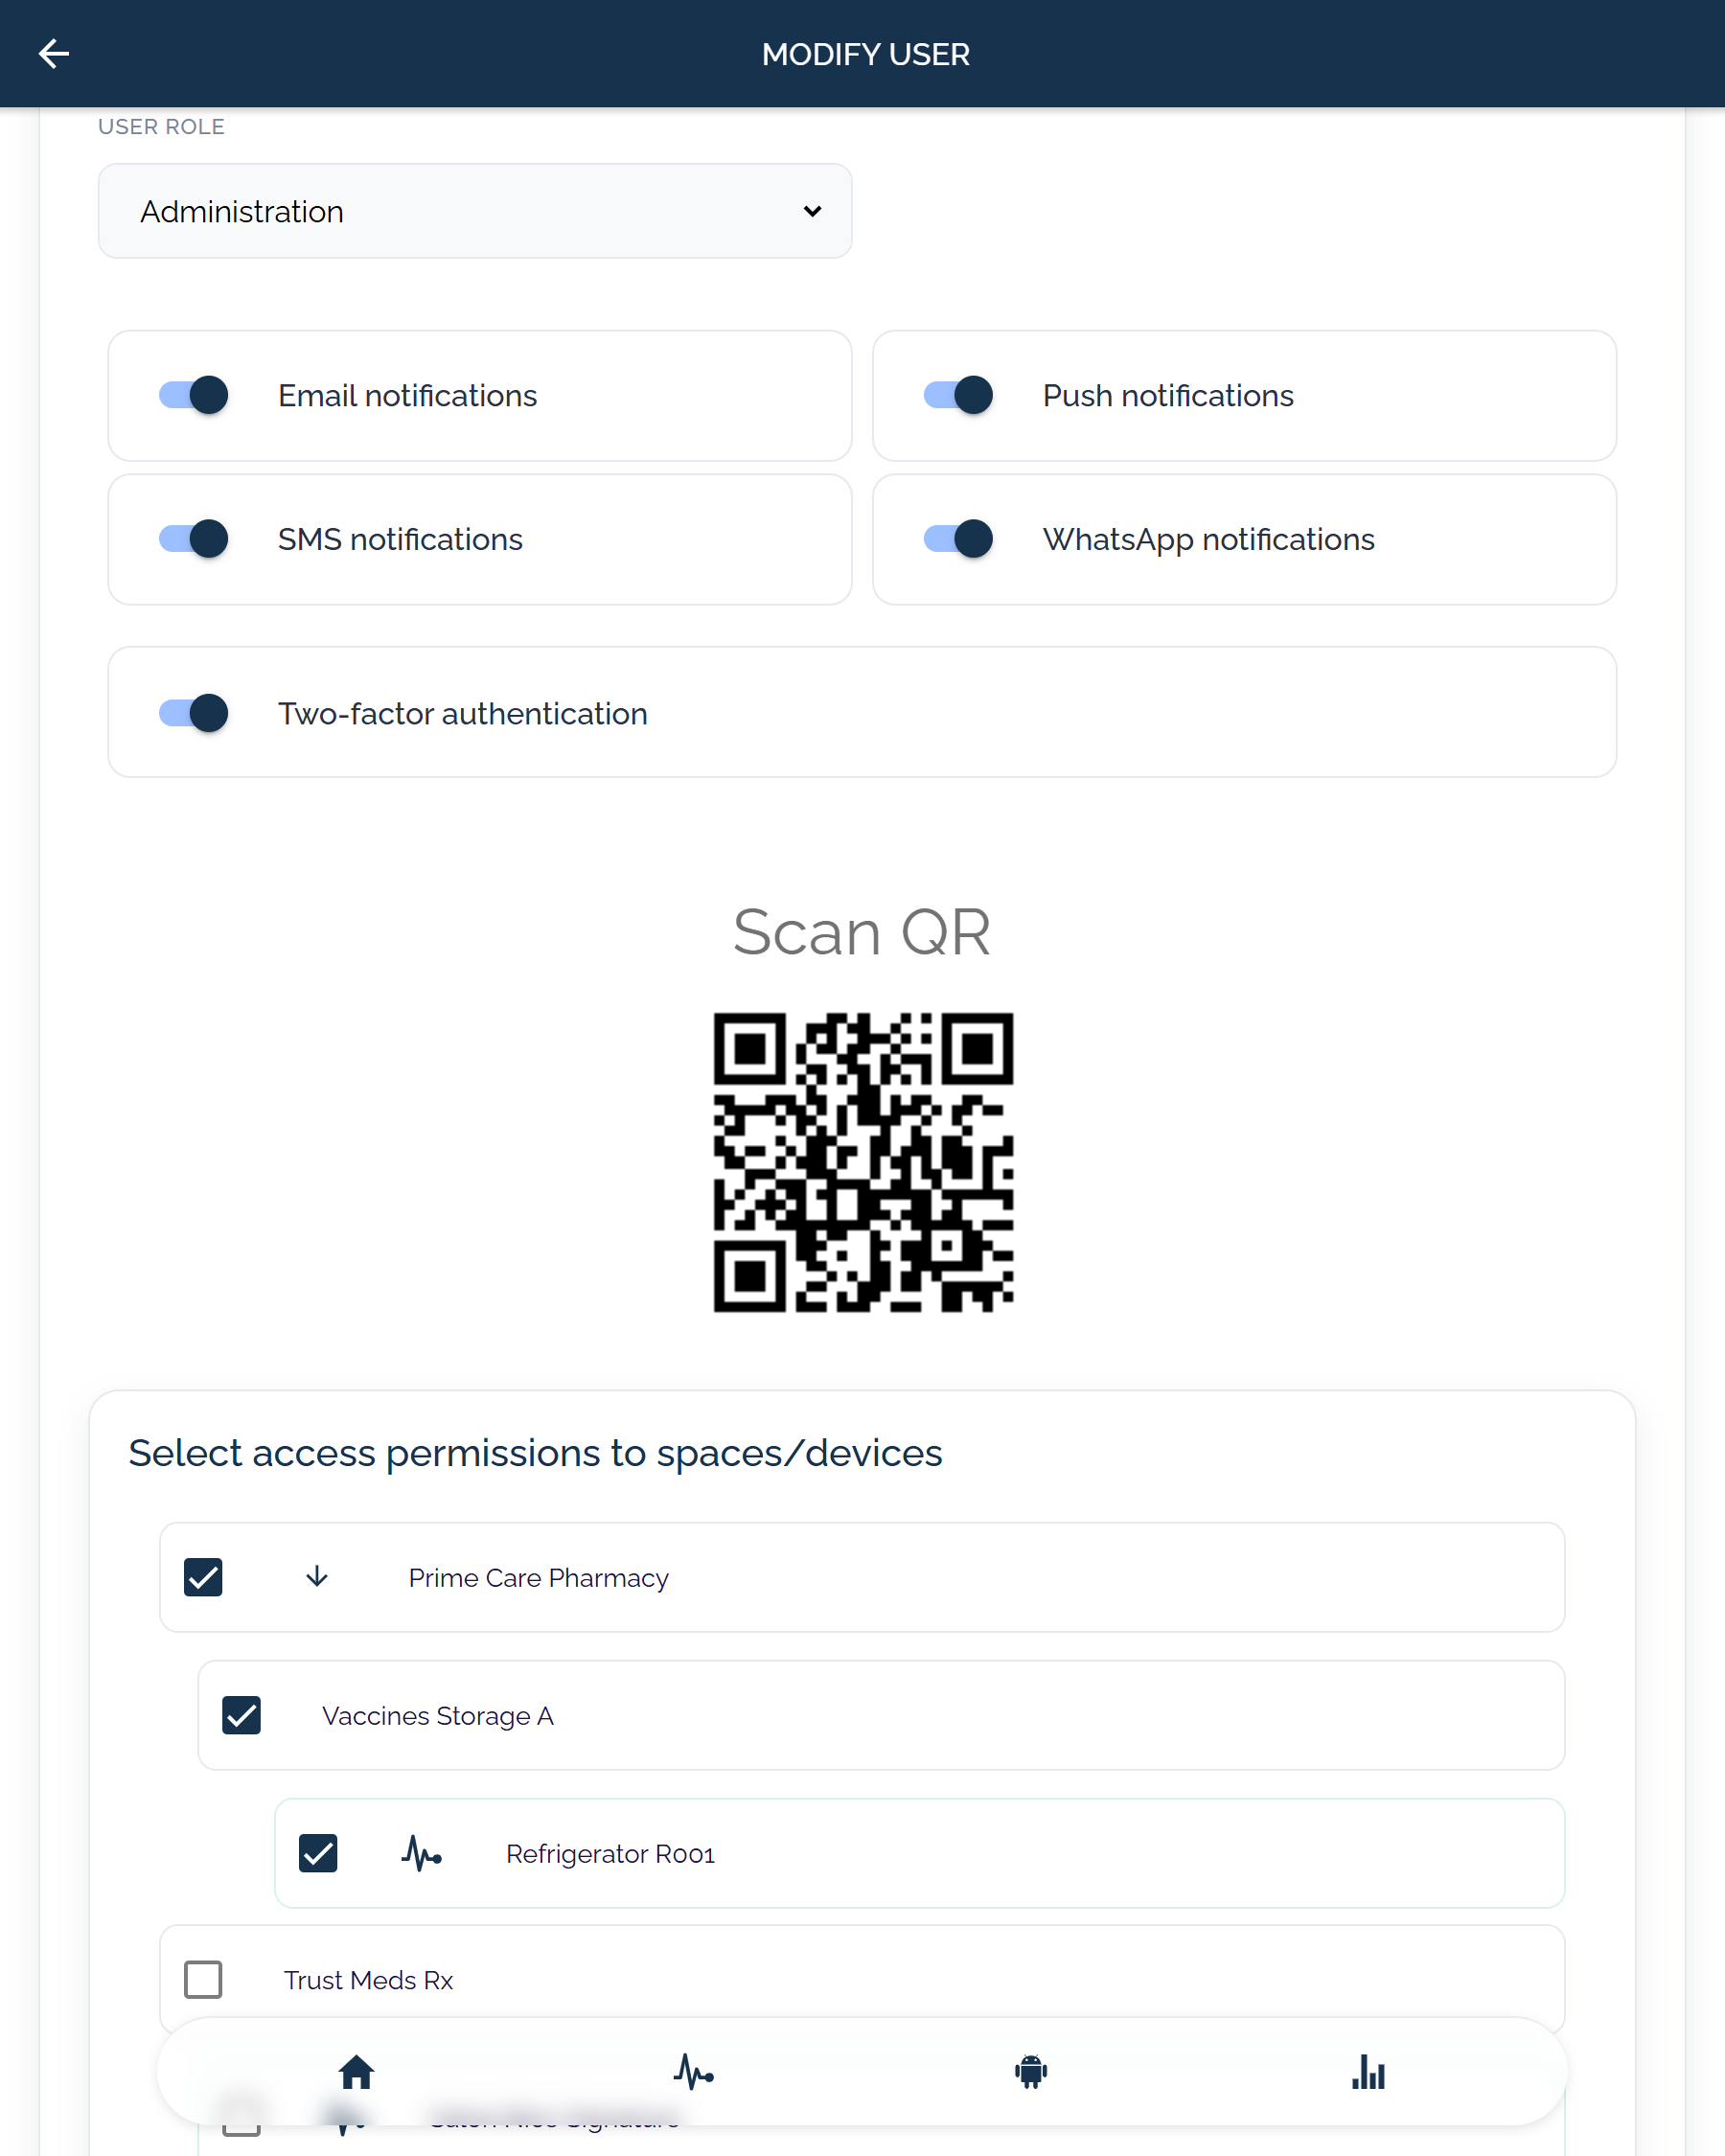
Dashboard workspace with scoped access and retained history
The same workspace that supports daily monitoring also supports multi-user teams, role-based permissions, secure login, and controlled access by site, space, or device.
User access view
Shape the temperature monitoring dashboard around your sites
Request a demo if you need to map assets, sites, alert channels, user access, and historical review into one operating view. If the scope is already clear, you can move into pricing.
- Multi-site visibility
- Retained history
- Connected alerts and records